Virtual-fit assessment of full-arch implant photogrammetry accuracy in a human cadaver model
Journal of Dentistry 170 (2026). Extraoral photogrammetry (iCam and MicronMapper) demonstrated higher and more consistent accuracy than intraoral workflows for complete-arch implant impressions in a fresh human cadaver model.
Michael DeFee a, Walter Renne a, Muhammad Ali Shazib b, Allan Queiroz a, Anthony Mennito a, Daniel Borbola c, Janos Vag c,*
a The MOD Institute, 320 Broad St. #210 Charleston, SC 29401, United States b Department of Dental Medicine, Workman School of Dental Medicine, High Point University, 770 Qubein Ave, High Point, NC 27268, United States c Department of Restorative Dentistry and Endodontics, Faculty of Dentistry, Semmelweis University, Szentkirályi utca 47, H-1088, Budapest, Hungary
* Corresponding author at: Department of Restorative Dentistry and Endodontics, Semmelweis University, Szentkirályi utca 47, H-1088, Budapest, Hungary. E-mail address: vag.janos@semmelweis.hu (J. Vag).
Journal of Dentistry 170 (2026) 106668Received 1 March 2026Received in revised form 27 March 2026Accepted 31 March 2026Available online 1 April 2026doi.org/10.1016/j.jdent.2026.106668
Objectives: To evaluate the accuracy of extraoral (EPG) and intraoral photogrammetry (IPG) based complete-arch implant workflows in the maxilla and mandible using a fresh human cadaver model, and to compare conventional best-fit deviation metrics with a clinically interpretable virtual-fit assessment.
Methods: An edentulous maxilla and mandible of a fresh human cadaver received six implants per arch, restored with multi-unit abutments; one low-torque implant was excluded. A reference dataset was obtained using an ATOS Q industrial scanner. Test scans were acquired with iCam, MicronMapper, and an Aoralscan Elite intraoral scanner using ioConnect scan bodies and/or Elite Photogrammetry markers. After conversion to multi-unit connection geometries, accuracy was evaluated using penetration-type best-fit alignment (mean absolute deviation, MAD) and a non-interpenetrating virtual-fit protocol, simulating prosthetic seating, and quantifying marginal gap (MG) and absolute marginal discrepancy (AMD).
Results: In the mandible, iCam and MicronMapper demonstrated significantly better trueness (lower MG and AMD) than ioConnect, whereas in the maxilla, only iCam remained significantly superior. Precision was higher for iCam and MicronMapper than for ioConnect and IPG in the mandible. In the maxilla, iCam, MicronMapper, and ioConnect all showed significantly better precision than IPG. Median AMD ranged from 38 to 97 µm across systems, although individual IPG scans frequently exceeded 100 µm. MAD correlated strongly with MG and AMD (r = 0.89–0.91) but underestimated misfit, with discrepancies reaching up to 150 µm.
Conclusion: EPG demonstrated higher and more consistent accuracy than intraoral workflows. Virtual-fit assessment provided a clinically more meaningful evaluation than conventional best-fit metrics, which systematically underestimated prosthetic misfit because penetration-type ICP alignment distributes errors across the dataset, potentially masking localized misfit.
Clinical significance: For complete-arch implant impressions, EPG currently provides the most reliable accuracy. Intraoral workflows, particularly IPG, may show greater variability and should be used with caution. Clinically interpretable evaluation methods are essential to determine the true clinical acceptability of digital implant workflows.
1. Introduction
Intraoral scanners (IOS) are widely adopted in digital dentistry; however, complete-arch implant rehabilitations remain challenging. Long-span edentulous scans are prone to cumulative stitching errors, compromising trueness and limiting the predictability of full-arch implant frameworks [1–4]. Although stereophotogrammetry-based systems—extraoral (EPG) and intraoral photogrammetry (IPG)—have been introduced to address this limitation [5,6], the extent to which scan inaccuracies translate into clinically relevant prosthetic misfit remains unclear.
Stereophotogrammetry-based systems aim to improve spatial consistency over long spans by using marker-based triangulation rather than surface stitching. EPG employs synchronized multicamera setups and optical markers attached to implants, enabling accurate landmark-based implant registration with fixed acquisition geometry [7,8]. IPG implemented in the Aoralscan Elite IOS (Shining 3D, China) represents a related approach in which a single camera captures sequential images of coded fiducial markers; implant positions are reconstructed computationally from multiple views rather than a fixed stereo configuration.
In contrast, conventional IOS workflows rely on frame-by-frame surface stitching, which accumulates error across complete arches, particularly in edentulous regions or when scan bodies are closely spaced and geometrically repetitive [1–3]. Horizontal scan body designs, such as ioConnect (TruAbutment, USA), reduce effective arch length and enhance feature recognition, improving trueness compared with standard IOS protocols.
IOS accuracy is substrate-dependent, as optical properties such as translucency, reflectivity, and refractive index influence light scattering and point localization during structured illumination acquisition [9–12]. To minimize substrate-related bias and better approximate clinical conditions, fresh human cadaver models have been advocated as more representative of in vivo scanning environments [9,13–15].
The validity of IOS accuracy studies critically depends on the reference standard used to define geometric ground truth. Errors in the reference dataset directly compromise interpretability; however, many investigations rely on dental laboratory scanners [6,16–22] that may introduce geometric distortion [23,24]. High-precision industrial metrology systems, such as ATOS, have therefore been recommended. ATOS is a non-contact blue-light structured scanner with multicamera fringe projection, achieving uncertainty within 2 μm for jaw-sized objects, with performance validated according to ISO 10360-13:2021 and VDI/VDE 2634 standards [25,26]
Equally critical is the computational strategy used to compare test datasets with the reference standard. IOS trueness is typically evaluated using global iterative closest point (ICP) best-fit alignment, which lacks a defined point of origin and distributes discrepancies across the dataset, potentially masking localized or systematic errors [1,27,28]. Such unconstrained alignment can artificially reduce deviation values and underestimate true prosthetic misfit [29,30].
The virtual-fit method instead simulates prosthetic seating by prohibiting surface interpenetration, enabling clinically interpretable assessment of marginal and internal gaps [24,29,31,32]. However, its application in implant workflows has been limited to indirectly scanned models using laboratory scanners [30], and it has not been validated for direct implant scanning in cadaveric conditions. Moreover, previous implementations did not account for abutment–cap clearance inherent to multi-unit systems, which may partially compensate for geometric inaccuracy and is essential for clinically meaningful interpretation. Therefore, a clinically interpretable evaluation of implant scanning accuracy using a non-interpenetrating virtual-fit approach applied to prosthetic components under cadaver conditions remains lacking.
The aims of the study were to evaluate the accuracy of extraoral and intraoral photogrammetry-based complete-arch implant impression workflows in the maxilla and mandible using a fresh human cadaver model, and to compare conventional best-fit deviation metrics with a clinically interpretable virtual-fit assessment. The first null hypothesis was that the accuracy of the four tested acquisition systems did not differ. The second null hypothesis was that the marginal gap (MG) and the absolute marginal discrepancy (AMD) do not deviate from the mean absolute deviation (MAD) measured by the conventional penetrated alignment.
2. Materials and methods
2.1. Preparation of the scan specimens
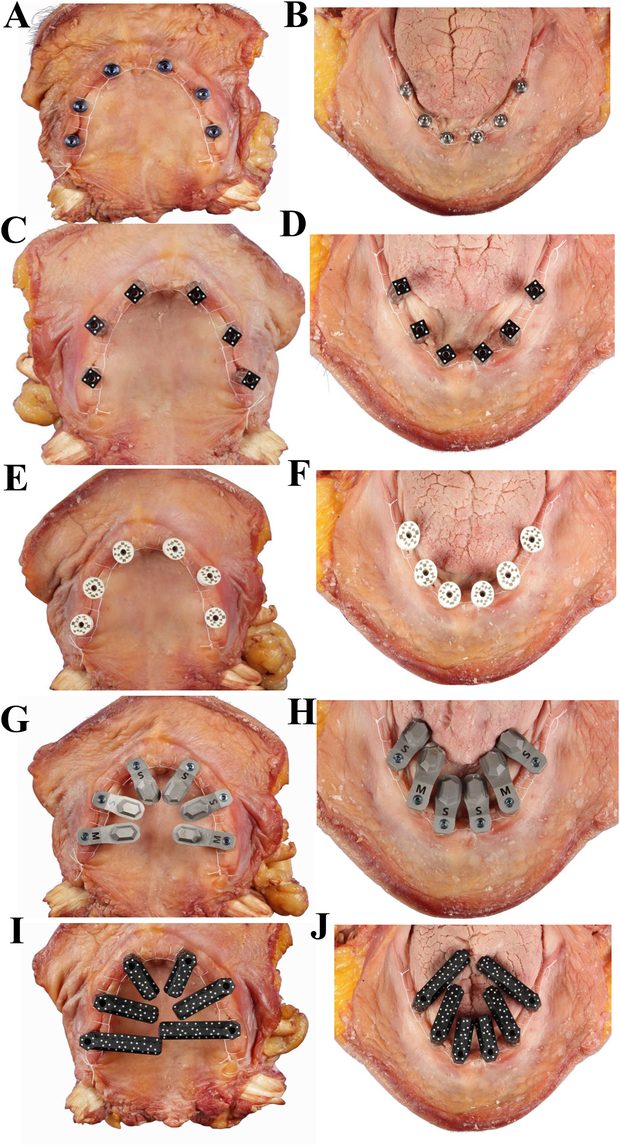
Six endosseous implants (Helix GM; Neodent®, Brazil) were placed in each arch by an experienced surgeon in a prosthetically optimal configuration (Table 1). An insertion torque ≥ 60 Ncm was achieved at all sites except site 13 (20 Ncm), which was excluded from analysis due to potential instability. Multi-unit abutments were placed to achieve a ≥ 1 mm supragingival platform height (Fig. 1A, B).
Fig. 1. Intraoral photographs of the cadaver tissue with scan bodies in place. Six endosseous implants were placed in both the maxilla (A) and mandible (B) of a fresh cadaver specimen, and multi-unit abutments were placed to achieve an ideal configuration and an abutment platform level 1 mm supragingival. iCam optical markers were placed on each multi-unit abutment and hand-tightened in place prior to capturing the implant position in both the maxilla (C) and mandible (D). MicronMapper optical markers were placed on each multi-unit abutment and hand-tightened in place prior to implant position capture in both the maxilla (E) and mandible (F). ioConnect scan bodies were placed on each multi-unit abutment facing toward the center of the respective arch and hand-tightened in both the maxilla (G) and mandible (H). IPG scan bodies were placed on each multi-unit abutment facing toward the center of the respective arch and tightened to 15 Ncm in both the maxilla (I) and mandible (J).
2.2. Scanning the specimens
Each specimen was coated with scanning spray (CEREC Optispray; Dentsply Sirona, Germany) and digitized using an industrial reference scanner (ATOS Q; Zeiss GmbH, Germany).
Four acquisition systems were evaluated (Table 2). Two EPG systems: iCam4D Bodies optical markers (MU, RP 1.4; Imetric, Switzerland) (Fig. 1C, D) used with the iCam camera (Generation 4; Imetric, Switzerland), and Posts MicronMapper optical markers (Fig. 1E, F) with the MicronMapper (ClaroNav, Canada). Two intraoral systems using the Aoralscan Elite IOS: (1) standard scanning mode with ioConnect scan bodies (TruAbutment) (Fig. 1G, H) based on active triangulation, and (2) video photogrammetry mode with Elite Photogrammetry markers (Shining 3D) (Fig. 1I, J) comprise the IPG group.
All markers and scan bodies were hand-tightened and remained in position throughout digitization. In both EPG systems, the two-sided optical markers were fully visible in the specimen's frontal view during image acquisition. For the ioConnect group, a circular scan pattern focusing exclusively on the scan body hexagons was used to minimize stitching error and generate complete-arch implant scans. For the IPG group, the manufacturer-recommended scan strategy was followed to capture marker geometry.
All scanners were calibrated prior to use, and ten scans per system were performed to obtain stable estimates of trueness and precision while maintaining feasibility under cadaver conditions, consistent with previous studies evaluating digital implant impression accuracy [5,14,18,20,22,34,35].
Four clinicians performed the scanning procedures. Each operator had more than one year of experience with the respective system, had received formal training from the manufacturer, and had completed >100 clinical scans prior to the study. All scans were performed in the same room under identical environmental conditions, with constant ambient lighting of approximately 500–1000 lx.
The captured geometry was converted within the proprietary software to ioConnect HS Cap Small geometry (TruAbutment), and unified implant location STL files were exported. All datasets were imported into DentalCAD (v3.2, Elefsina; ExoCAD GmbH, Germany) and converted to identical multi-unit (1.4 standard Nobel-compatible) connection geometry for standardized downstream analysis.
Table 2 — Test groups based on scanners and scan body system.
Groups
Scan body
Scan body Manufacturer
Scanner
Scanner Manufacturer
Technology
iCam4D
iCamBodies
Imetric, Courgenay, Switzerland
iCam4D Camera
Imetric
stereo photogrammetry
MicronMapper
Posts MicronMapper
ClaroNav, Toronto, Canada
MicronMapper
ClaroNav
stereo photogrammetry
ioConnect
ioConnect
TruAbutment, Irvine, CA, USA
Aoralscan Elite (standard mode)
Shining 3D, Hangzhou, China
active triangulation
IPG
Elite Photogrammetry marker
Shining 3D
Aoralscan Elite (photogrammetry mode)
Shining 3D
video photogrammetry
2.3. Performing alignments
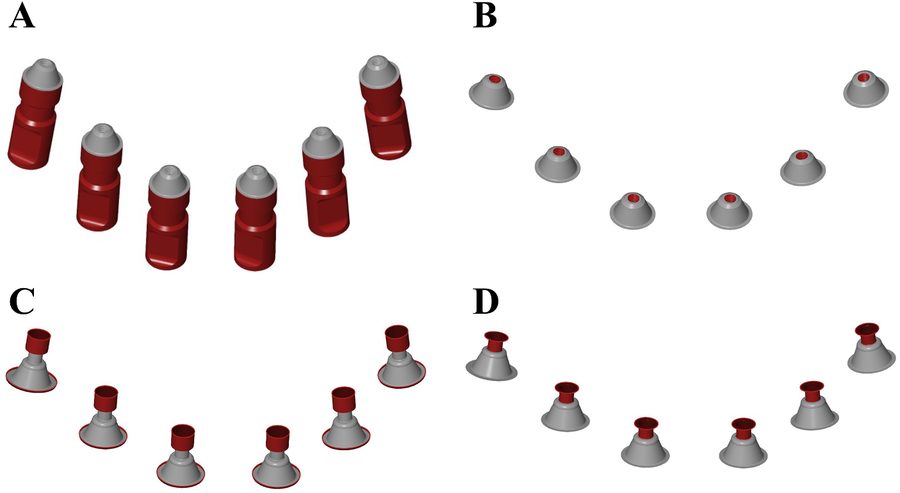
All alignments and gap measurements were performed using Zeiss Inspect software (version 2025.1.0.1985; Zeiss GmbH). Prior to alignment, the implant analogs and screw access channels were removed from both the reference and test datasets, retaining only the multi-unit platform geometry (Fig. 2A, B). For the bottom-abutment CAD files (multi-unit caps), the collar and neck regions were removed, preserving only the intaglio surfaces directly contacting the multi-unit platform (Fig. 2C, D).
After cropping, two alignment strategies were applied using a best-fit procedure based on the ICP algorithm:
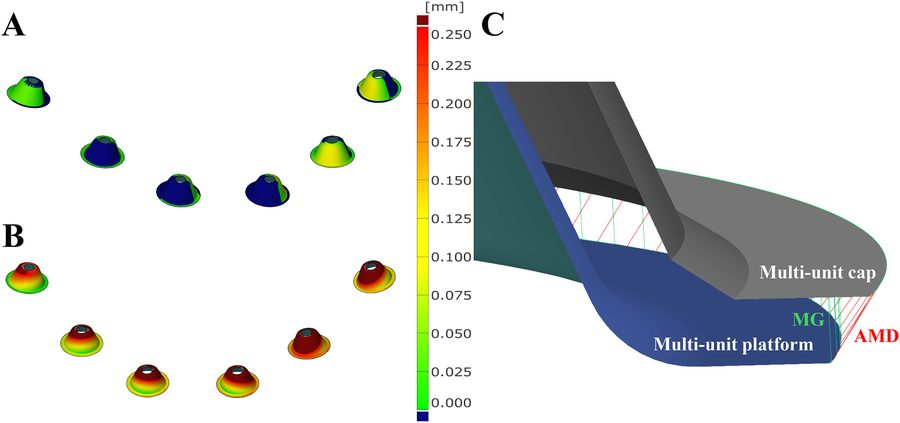
Conventional alignment: The multi-unit platforms of the ATOS Q reference scan were aligned to those of each test scan using standard penetration-type ICP best-fit alignment (Fig. 3A).
Virtual-fit alignment: The ATOS Q multi-unit platforms were aligned to the digitally designed multi-unit caps of the test datasets using the previously described virtual-fit method [29,30]. This was followed by an “outside” alignment procedure implemented in ZEISS Inspect (Local Best-Fit with Tolerances). The algorithm performs a least-squares best-fit optimization between the selected mesh points and the target surface while restricting the fitting zone to the outer side of the target surface. This constraint prevents mesh interpenetration and thereby simulates prosthetic seating conditions. Consequently, only positive deviations were permitted, simulating the physical seating of rigid components (platform and cap), where geometric overlap cannot occur (Fig. 3B).
Fig. 2. Cropping of CAD files prior to best-fit alignment. (A) First, the analog portion of the virtual model, located below the platform of the multi-unit analogs, was selected (red area) and deleted. (B) Next, the screw-thread region—consisting of 13 lines of triangles—was selected and removed. (C) The multi-unit caps were designed on the virtual model and exported from exocad. Then, two lines of triangles were selected from the top and bottom edges, and they were deleted. (D) Finally, the remaining portion of the cap “shaft” was removed.
Fig. 3. Alignment of the reference scan with the test scans. (A) Conventional best-fit alignment between the multi-unit platform present in the reference scan and the corresponding platform in the test scan (i.e., virtual model). (B) The same meshes shown in B after alignment by the virtual-fit method. The color scale of the surface comparison is identical in all three panels. Blue indicates negative deviation values, meaning that the surface of the test mesh lies below the surface of the reference mesh. Please note that no blue color is visible in panel B (C). Measurement of the marginal gap (MG, green) and the absolute marginal discrepancy (AMD, red). For illustrative clarity, the density of distance lines shown between the curves has been reduced relative to the actual measurement resolution.
2.4. Measurement of accuracy
For conventional multi-unit platform–to–platform alignment, trueness was quantified as MAD using the surface comparison function in Zeiss Inspect and reported in micrometers. For the virtual-fit method, curves were constructed along the multi-unit platform edges and along the cap margins for each implant. The MG was defined as the perpendicular distance between the platform-edge curve and its projected counterpart on the cap surface (i.e., the shortest distance) (Fig. 3C). The AMD was defined as the distance between the platform-edge curve and the actual cap margin. Distances were sampled at 0.01 mm intervals along all curves.
2.5. Statistics
The median of each measurement set was used as the estimate of trueness, and dispersion around the median was interpreted as precision. Group differences were analyzed using the median test with Bonferroni correction. Pearson’s correlation assessed the association between conventional penetration-type multi-unit alignment and virtual-fit MG and AMD measurements. Agreement was evaluated using Bland–Altman analysis, and proportional bias was tested by linear regression. Analyses were performed in SPSS (v30; IBM, USA).
3. Results
3.1. Comparison of scanner accuracy
Descriptive statistics for the measured outcomes are presented in Table 3, while pairwise median differences and adjusted p-values between scanners are provided in Table 4.
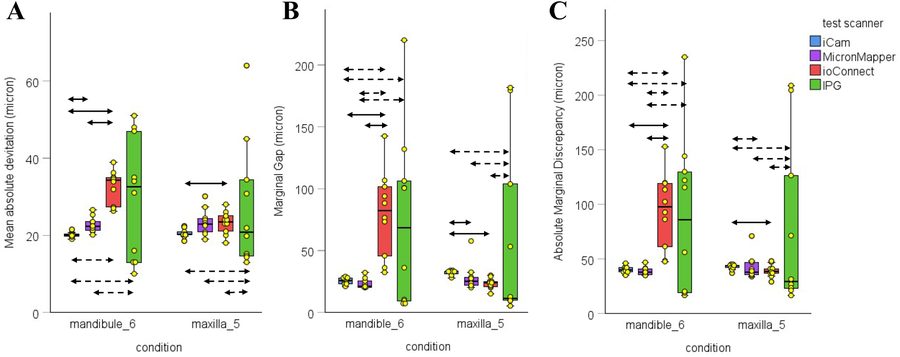
Overall, the dedicated extraoral photogrammetry (EPG) systems (iCam and MicronMapper) demonstrated the highest accuracy and consistency across both arches for all evaluated metrics (Fig. 4). In contrast, the IPG workflow showed substantially greater variability. The ioConnect workflow performed worse in the mandible, similar to IPG, whereas in the maxilla, its accuracy was comparable to that of the EPG systems.
The median MAD for iCam was significantly lower than for MicronMapper (p < 0.01) and ioConnect (p < 0.001) in the mandible (Fig. 4A). The MAD for MicronMapper was also significantly lower than for ioConnect (p < 0.001). In the maxilla, the median MAD values for iCam (p < 0.05) was significantly lower than for ioConnect.
The spread of MAD values for iCam was significantly lower than for ioConnect (p < 0.01) and IPG (p < 0.01) in the mandible. The spread was also significantly lower for MicronMapper than for IPG (p < 0.001). In the maxilla, the spread of MAD values for iCam (p < 0.001), MicronMapper (p < 0.01), and ioConnect (p < 0.01) was significantly lower than for IPG.
The MG for iCam (p < 0.001) and MicronMapper (p < 0.001) was significantly lower than for ioConnect and in the mandible (Fig. 4B). In the maxilla, the MG for MicronMapper (p < 0.05) and ioConnect (p < 0.01) was significantly lower than for iCam.
The spread of MG values for iCam was significantly lower than for ioConnect (p < 0.01) and IPG (p < 0.001) in the mandible. The spread was also significantly lower for MicronMapper than for ioConnect (p < 0.05) and IPG (p < 0.001). In the maxilla, the spread of MG values for iCam (p < 0.001), MicronMapper (p < 0.01), and ioConnect (p < 0.01) was significantly lower than for IPG.
The AMD for iCam (p < 0.001) and MicronMapper (p < 0.001) was significantly lower than for ioConnect in the mandible (Fig. 4C). In the maxilla, the AMD for ioConnect was significantly lower than for iCam (p < 0.05).
The spread of AMD values for iCam was significantly lower than for ioConnect (p < 0.01) and IPG (p < 0.001) in the mandible. The spread was also significantly lower for MicronMapper than for ioConnect (p < 0.05) and IPG (p < 0.001). In the maxilla, the spread of AMD values for iCam was significantly lower than for MicronMapper (p < 0.01) and IPG (p < 0.01). The spread of AMD values for MicronMapper was significantly lower than for IPG (p < 0.01). The spread of AMD values for ioConnect was significantly lower than for IPG (p < 0.01).
Table 3 — The accuracy of the tested scanner in different conditions was measured by various methods in micrometers.
Condition
Metric
Test scanner
N
Mean
SD
Median
Q1
Q3
mandibul_6
MAD
iCam
10
20
0.67
20
19.7
20.4
MicronMapper
9
23
2.11
22
21
24
ioConnect
10
33
4.33
34
27
35
IPG
10
30
15.88
33
13
47
MG
iCam
10
26
2.80
26
23
28
MicronMapper
9
23
4.19
21
21
25
ioConnect
10
80
34.61
82
46
102
IPG
10
73
71.28
68
9
106
AMD
iCam
10
40
3.19
40
38
42
MicronMapper
9
39
3.92
38
36
41
ioConnect
10
94
34.27
97
61
119
IPG
10
88
73.45
86
19
130
maxilla_5
MAD
iCam
10
20
1.13
20
20.1
20.9
MicronMapper
10
23
3.31
23
20.8
24.4
ioConnect
10
23
2.94
24
21
25
IPG
10
27
16.62
21
15
34
MG
iCam
10
32
1.91
33
31
33
MicronMapper
10
28
11.08
25
22
29
ioConnect
10
24
4.35
24
21
25
IPG
10
57
71.77
11
10
104
AMD
iCam
10
43
2.50
44
42
44
MicronMapper
10
42
11.24
38
35
47
ioConnect
10
39
5.65
39
37
41
IPG
10
75
76.87
29
23
126
N, sample number; SD, standard deviation; Q1, first quartile; Q3, third quartile. MAD, Mean absolute deviation; MG, Marginal Gap; AMD, Absolute Marginal Discrepancy; IPG, intraoral photogrammetry.
Fig. 4. The accuracy of the test scanner expressed in mean absolute deviation (A), marginal gap (B), and absolute marginal discrepancy (C) after multi-unit-based alignment. The box plot indicates the median, and the first and third quartiles. The yellow dots represent individual scan data. The double-sided arrow with solid lines indicates the significant difference in median (i.e., trueness) between scanners. The double-sided arrow with dotted lines indicates the significant difference in data spread (i.e., precision) between scanners.
Table 4 — Difference between the medians of the scanners in micrometers.
Condition
Metric
Test scanner 1
Test scanner 2
Trueness median difference
p-valuesa
Precision median difference
p-valuesa
mandibule_6
MAD
iCam
MicronMapper
2.40
0.004
1.27
0.071
iCam
ioConnect
14.20
0.000
2.66
0.002
iCam
IPG
12.50
1.000
16.45
0.002
MicronMapper
ioConnect
11.80
0.001
1.39
1.000
MicronMapper
IPG
10.10
1.000
15.18
0.001
ioConnect
IPG
− 1.70
1.000
13.79
0.442
MG
iCam
MicronMapper
− 4.60
1.000
0.44
0.071
iCam
ioConnect
56.90
0.000
21.96
0.002
iCam
IPG
42.80
1.000
58.25
0.000
MicronMapper
ioConnect
61.50
0.001
21.52
0.016
MicronMapper
IPG
47.40
1.000
57.81
0.001
ioConnect
IPG
− 14.10
1.000
36.29
0.442
AMD
iCam
MicronMapper
− 2.20
1.000
0.54
0.660
iCam
ioConnect
57.45
0.000
22.91
0.002
iCam
IPG
45.70
1.000
59.70
0.000
MicronMapper
ioConnect
59.65
0.001
22.37
0.016
MicronMapper
IPG
47.90
1.000
59.16
0.001
ioConnect
IPG
− 11.75
1.000
36.79
0.442
maxilla_5
MAD
iCam
MicronMapper
2.75
1.000
1,40
1.000
iCam
ioConnect
3.30
0.044
1.60
1.000
iCam
IPG
0.65
1.000
11.96
0.000
MicronMapper
ioConnect
0,55
1,000
0,20
1.000
MicronMapper
IPG
-2,10
1.000
10,56
0.002
ioConnect
IPG
− 2.65
1.000
10.36
0.002
MG
iCam
MicronMapper
− 7.90
0.044
4.26
0.148
iCam
ioConnect
− 9.00
0.002
1.00
1.000
iCam
IPG
− 21.80
1.000
46.80
0.000
MicronMapper
ioConnect
− 1.10
1.000
− 3.26
0.442
MicronMapper
IPG
− 13.90
1.000
42.54
0.002
ioConnect
IPG
− 12.80
1.000
45.80
0.002
AMD
iCam
MicronMapper
− 5.90
1.000
4.58
0.002
iCam
ioConnect
− 5.00
0.044
0.70
1.000
iCam
IPG
− 14.45
1.000
50.69
0.002
MicronMapper
ioConnect
0.90
1.000
− 3.88
0.442
MicronMapper
IPG
− 8.55
1.000
46.11
0.002
ioConnect
IPG
− 9.45
1.000
49.99
0.002
MAD, Mean absolute deviation; MG, Marginal Gap; AMD, Absolute Marginal Discrepancy; IPG, intraoral photogrammetry. a Significance values have been adjusted by the Bonferroni correction for multiple tests.
3.2. Comparison of alignment methods
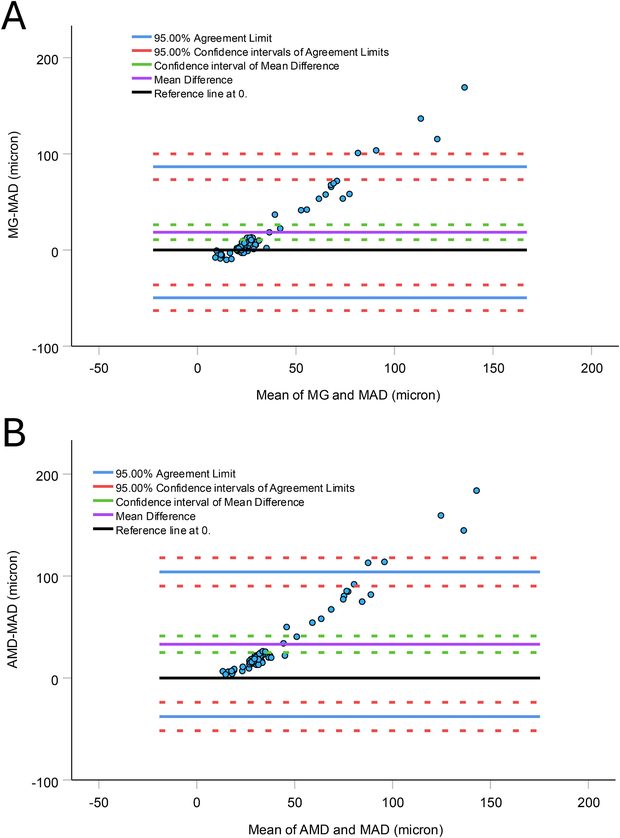
The MAD values after penetration-type multi-unit alignment were significantly correlated with the MG (r = 0.89, p < 0.001) and AMD after virtual fit (r = 0.91, p < 0.001). However, MAD underestimated the MG and AMD by 18.5 μm [10.7 - 26.3 μm] and 33.1 μm [20.5 - 41.2 μm], respectively (Fig. 5).
Furthermore, a significant proportional bias (p < 0.001) was observed in MG and AMD. Based on the linear regression function between the mean and the difference, above 25 μm MAD, the MAD becomes 20 μm higher than the MG. At around 50 μm MAD, the MG is tripled to 150 μm.
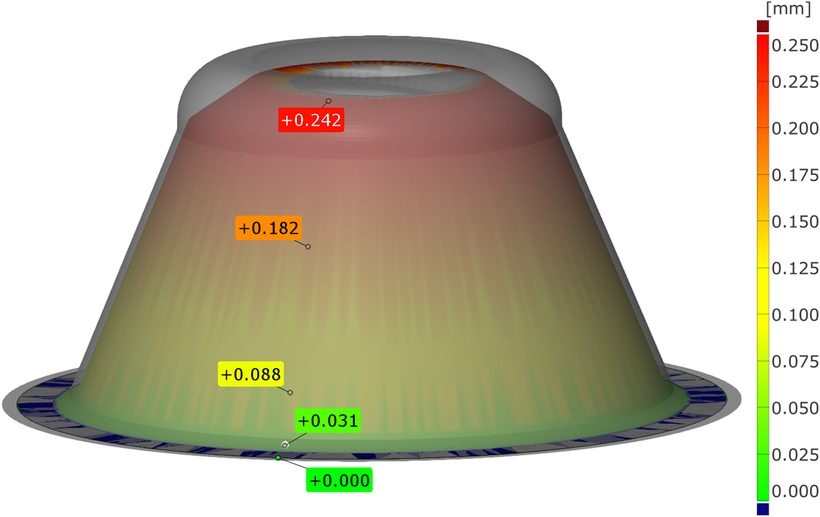
The manufacturer applies a clearance between the multi-unit platform and the caps, up to 250 μm, gradually increasing from the margin to the top (Fig. 6). Because this tolerance value is not specified in the manufacturer’s technical documentation, it was determined by direct measurement from the CAD geometry of the platform–cap assembly. This clearance was able to override the physical constraint simulated by the virtual fit for accurate scans. However, above approximately 25 μm MAD, the clearance is insufficient to compensate for the scan error. The MAD for the worst scan was <70 μm, yet it would still be considered acceptable when evaluated solely by MAD.
Fig. 5. Bland–Altman plots comparing the clinically oriented virtual-fit method with the conventional penetrated best-fit alignment. (A) The difference between the marginal gap (MG) and mean absolute deviation (MAD) obtained by the two methods is plotted against their common mean. (B) The difference between absolute marginal discrepancy (AMD) and MAD obtained by the two methods is plotted against their common mean.
Fig. 6. Internal clearance of the multi-unit platform and the multi-unit caps. The virtual model of an IPG scan was exported from ExoCAD together with the corresponding CAD design of the bottom abutment. The relative orientation of the model and the design was maintained during import into Zeiss Inspect software for surface comparison. The color-coded surface comparison is projected on the multi-unit platform. The labels indicated the distance between the platform and the caps in millimeters.
4. Discussion
The first null hypothesis was rejected because significant differences were observed across systems for all parameters. The two EPG systems demonstrated superior trueness and precision compared with the intraoral approaches.
The second null hypothesis was rejected. MG and AMD obtained with the virtual-fit approach were systematically greater than deviations derived from conventional penetration-based best-fit alignment. The MAD from penetrated alignment represents a global error metric that aggregates discrepancies across the entire geometry. Therefore, redistributing the systematic and random components masks functionally critical deviations at implant–abutment interfaces. In contrast, the virtual-fit method simulates prosthetic seating, prohibits surface interpenetration, and isolates clinically meaningful contact conditions, resulting in systematically larger and more realistic gap values.
Importantly, conventional alignment also ignores intentional abutment–cap clearance, which can reach approximately 250 µm depending on connection design. This manufactured clearance may partially compensate for geometric inaccuracies, but cannot be quantified due to undisclosed manufacturer specifications. Consequently, penetration-type best-fit deviation values cannot be interpreted as surrogates for marginal fit parameters and may substantially underestimate clinically relevant misfit, particularly in lower-performing scan systems.
The total error of a complete-arch digital implant workflow can be estimated using Euclidean error propagation, combining the squared contributions of scanning and CAD–CAM manufacturing steps [24,36–38]. CAD–CAM discrepancies for complete-arch frameworks, excluding impression error, have been reported to range from 19 to 100 µm [33,39–42]. Adopting 100 µm as a conservative estimate of manufacturing contribution and a clinically acceptable total misfit threshold of 150 µm for complete-arch frameworks [43], the permissible scanning error can be estimated as:
√1502 − 1002 ≈ 110 μm
This value represents a theoretical estimate derived from conservative assumptions and should therefore be interpreted as an approximate guideline rather than a strict clinical threshold. Accordingly, intraoral scanning inaccuracies exceeding approximately 110 µm would be expected to compromise overall framework fit under conservative assumptions. In the present study, median MG and AMD values for all systems were below this threshold. However, multiple individual scans obtained with ioConnect and IPG exceeded 110 µm, particularly for AMD, indicating reduced precision and limited reliability across repeated acquisitions.
The most appropriate comparison with existing literature is based on MAD between multi-unit analogues, as MAD and root-mean-square error (RMS) similarly describe average surface deviations after alignment [44,45]. Reported RMS values for EPG systems range from approximately 21 to 88 µm [16–20,22]. The present results for iCam and MicronMapper were at the lower boundary of this range and closely aligned with previously reported values for the same devices (24 µm and 21 µm, respectively) [16,22]. Importantly, comparable accuracy was achieved despite the presence of cadaveric soft tissues and sutures, whereas most prior studies used stone or resin models. This consistency likely reflects the stereophotogrammetry principle, which determines implant position exclusively from rigid fiducial markers and is largely independent of surrounding tissue geometry. Accordingly, photogrammetry-based systems appear well-suited for accurate implant position registration, even in immediate surgical conditions, and have been shown to outperform conventional impressions [16,18–20].
Consistent with our findings, previous studies similarly report significantly greater deviations for commonly used IOS platforms compared with EPG systems [5,16,18–20,22]. Although newer-generation IOS devices may approach EPG-level trueness under controlled conditions [5], EPG systems consistently demonstrate superior overall accuracy. Precision followed a comparable pattern. In the present study, the ioConnect workflow combined with Aoralscan Elite yielded lower MG and AMD values than EPG systems in the maxilla but performed significantly worse in the mandible. This arch-dependent behavior indicates that IOS-based workflows remain more sensitive to anatomical configuration and scanning span than EPG systems.
Because EPG systems require dedicated hardware beyond conventional IOSs, hybrid implant IPG approaches integrated into IOS platforms have been introduced to reduce cost and complexity. Previous reports suggest that the Aoralscan Elite in IPG mode may achieve trueness comparable to some EPG systems, although generally inferior to high-end stereophotogrammetry devices [5,6]. In the present study, however, IPG demonstrated markedly lower precision than EPG and, in the maxilla only, than conventional IOS workflow. The high within-system variability inflated standard errors and limited statistical discrimination of trueness despite substantial mean differences. Accordingly, non-significant findings in these comparisons should not be interpreted as equivalence but rather as a consequence of limited measurement convergence due to low precision. This limitation reflects the common practice in digital dentistry of reporting trueness and precision separately, whereas metrological standards typically integrate bias and variability into a single accuracy metric [26,46–48]. Under such an integrated framework, the IPG system would have demonstrated markedly inferior overall accuracy. However, separate reporting was maintained to ensure comparability with existing dental literature.
Moreover, IPG was the only system showing pronounced arch-dependent behavior. These findings indicate that, while IPG may represent a cost-effective alternative to dedicated EPG hardware, its performance appears more sensitive to acquisition conditions and workflow consistency.
A primary strength of this study is the clinically oriented virtual-fit evaluation based on MG and AMD measurements. The use of a multi-unit platform restoration enhances clinical relevance, as inherent abutment–cap clearance introduces tolerance for geometric inaccuracies that must be considered when interpreting scanner performance in implant prosthodontics. Another strength is the use of fresh human cadaver specimens, preserving authentic hard- and soft-tissue morphology, implant angulation, and spatial constraints, thereby providing greater anatomical realism than in vitro models. Finally, unlike many previous studies that used laboratory scanners with accuracy comparable to that of the investigated systems, a high-accuracy industrial reference scanner was used. Consequently, this method minimized reference-related uncertainty. It also fulfills metrological recommendations that the reference system be substantially more accurate than the variability under investigation (“rule of tens”) [46,48].
One limitation of this study is that, although conducted under controlled cadaver conditions, the model does not fully replicate clinical variables such as soft-tissue dynamics, fluid contamination, and patient-related movement. Furthermore, the findings are specific to the tested devices, software versions, and workflow configurations and should be generalized to other systems or future updates with caution.
The virtual-fit method evaluates geometric seating of the prosthetic components. It uses a rigid alignment that positions 3D models solely by translation and rotation, keeping their shapes and sizes unchanged. However, in clinical conditions, additional mechanical factors such as screw preload and elastic deformation of the framework may partially compensate for small misfits during tightening. Previous studies [49,50] have shown a substantial reduction in the vertical gap when comparing the one-screw test (i.e., passive fit) with the full-screw test (i.e., active fit). However, such deformation can introduce internal stresses in the prosthetic components and implants [51,52]. Consequently, the virtual-fit approach may provide a conservative estimate of seating accuracy by identifying geometric incompatibilities that could otherwise be masked by mechanical compensation.
5. Conclusions
Based on measurements of marginal gap and absolute marginal discrepancy using a clinically oriented virtual-fit approach, dedicated EPG systems demonstrated superior accuracy and robustness, supporting their use for complete-arch edentulous implant scans. Hybrid IPG exhibited substantially higher variability. ioConnect–assisted intraoral scanning achieved values within conservative clinically acceptable limits, but with reduced consistency across repeated acquisitions and arches.
CRediT authorship contribution statement
Michael DeFee: Writing – review & editing, Writing – original draft, Resources, Project administration, Methodology, Funding acquisition, Formal analysis, Data curation, Conceptualization. Walter Renne: Writing – review & editing, Writing – original draft, Funding acquisition, Data curation, Conceptualization. Muhammad Ali Shazib: Writing – review & editing, Resources, Investigation, Data curation, Conceptualization. Allan Queiroz: Writing – review & editing, Investigation, Data curation. Anthony Mennito: Writing – review & editing, Supervision, Investigation, Data curation, Conceptualization. Daniel Borbola: Writing – review & editing, Writing – original draft, Visualization, Investigation. Janos Vag: Writing – review & editing, Writing – original draft, Visualization, Validation, Software, Methodology, Funding acquisition, Formal analysis, Conceptualization.
Declaration of competing interest
The authors declare that they have no known competing financial interests or personal relationships that could have appeared to influence the work reported in this paper.
Acknowledgement
Authors acknowledgment for support of the Hungarian Scientific Research Fund (K_22, 142142). The authors declare that they have no known competing financial interests or personal relationships that could have influenced the work reported in this paper.
References
J. Vag, Z. Nagy, B. Simon, A. Mikolicz, E. Kover, A. Mennito, Z. Evans, W. Renne, A novel method for complex three-dimensional evaluation of intraoral scanner accuracy, Int. J. Comput. Dent. 22 (3) (2019) 239–249.
Z. Nagy, B. Simon, A. Mennito, Z. Evans, W. Renne, J. Vag, Comparing the trueness of seven intraoral scanners and a physical impression on dentate human maxilla by a novel method, BMC Oral Health 20 (1) (2020) 97, https://doi.org/10.1186/s12903-020-01090-x.
J. Li, Z. Chen, P. Nava, S. Yang, J. Calatrava, H.L. Wang, Calibrated intraoral scan protocol (CISP) for full-arch implant impressions: an in vitro comparison to conventional impression, intraoral scan, and intraoral scan with scan-aid, Clin. Implant Dent. Relat. Res. 26 (5) (2024) 879–888, https://doi.org/10.1111/cid.13338.
F. Eggmann, M.B. Blatz, Recent advances in intraoral scanners, J. Dent. Res. 103 (13) (2024) 1349–1357, https://doi.org/10.1177/00220345241271937.
F.G. Mangano, H. Lerner, G. Valle, F. Biaggini, C. Mangano, A. Dybov, Trueness of extraoral photogrammetry, intraoral photogrammetry and direct intraoral scanning in the full-arch digital implant impression: a comparative in vitro study, J. Dent. 165 (2026) 106269, https://doi.org/10.1016/j.jdent.2025.106269.
M. Revilla-Leon, M. Gomez-Polo, M. Drone, A.B. Barmak, J.C. Kois, J.A. Perez-Barquero, Accuracy of complete arch implant scans recorded by using intraoral and extraoral photogrammetry systems, J. Prosthet. Dent. 134 (6) (2025) 2508–2514, https://doi.org/10.1016/j.prosdent.2025.01.041.
J. Cheng, H. Zhang, H. Liu, J. Li, H.L. Wang, X. Tao, Accuracy of edentulous full-arch implant impression: an in vitro comparison between conventional impression, intraoral scan with and without splinting, and photogrammetry, Clin. Oral Implants Res. 35 (5) (2024) 560–572, https://doi.org/10.1111/clr.14252.
M.O. Hussein, Photogrammetry technology in implant dentistry: a systematic review, J. Prosthet. Dent. 130 (3) (2023) 318–326, https://doi.org/10.1016/j.prosdent.2021.09.015.
C. Bocklet, W. Renne, A. Mennito, T. Bacro, J. Latham, Z. Evans, M. Ludlow, A. Kelly, J. Nash, Effect of scan substrates on accuracy of 7 intraoral digital impression systems using human maxilla model, Orthod. Craniofac. Res. 22 (Suppl 1) (2019) 168–174, https://doi.org/10.1111/ocr.12273.
E. Dutton, M. Ludlow, A. Mennito, A. Kelly, Z. Evans, A. Culp, R. Kessler, W. Renne, The effect different substrates have on the trueness and precision of eight different intraoral scanners, J. Esthet. Restor. Dent. 32 (2) (2020) 204–218, https://doi.org/10.1111/jerd.12528.
J. Vag, W. Renne, G. Revell, M. Ludlow, A. Mennito, S.T. Teich, Z. Gutmacher, The effect of software updates on the trueness and precision of intraoral scanners, Quintessence Int. 52 (7) (2021) 636–644, https://doi.org/10.3290/j.qi.b1098315.
H. Li, P. Lyu, Y. Wang, Y. Sun, Influence of object translucency on the scanning accuracy of a powder-free intraoral scanner: a laboratory study, J. Prosthet. Dent. 117 (1) (2017) 93–101, https://doi.org/10.1016/j.prosdent.2016.04.008.
A.S. Mennito, Z.P. Evans, J. Nash, C. Bocklet, A. Lauer Kelly, T. Bacro, M. Cayouette, M. Ludlow, W.G. Renne, Evaluation of the trueness and precision of complete arch digital impressions on a human maxilla using seven different intraoral digital impression systems and a laboratory scanner, J. Esthet. Restor. Dent. 31 (4) (2019) 369–377, https://doi.org/10.1111/jerd.12485.
G. Revell, B. Simon, A. Mennito, Z.P. Evans, W. Renne, M. Ludlow, J. Vag, Evaluation of complete-arch implant scanning with 5 different intraoral scanners in terms of trueness and operator experience, J. Prosthet. Dent. 128 (4) (2022) 632–638, https://doi.org/10.1016/j.prosdent.2021.01.013.
J. Vag, C.D. Stevens, M.H. Badahman, M. Ludlow, M. Sharp, C. Brenes, A. Mennito, W. Renne, Trueness and precision of complete arch dentate digital models produced by intraoral and desktop scanners: an ex-vivo study, J. Dent. 139 (2023) 104764, https://doi.org/10.1016/j.jdent.2023.104764.
B. Ma, X. Yue, Y. Sun, L. Peng, W. Geng, Accuracy of photogrammetry, intraoral scanning, and conventional impression techniques for complete-arch implant rehabilitation: an in vitro comparative study, BMC Oral Health 21 (1) (2021) 636, https://doi.org/10.1186/s12903-021-02005-0.
H. Tohme, G. Lawand, R. Eid, K.E. Ahmed, Z. Salameh, J. Makzoume, Accuracy of implant level intraoral scanning and photogrammetry impression techniques in a complete arch with angled and parallel implants: an In vitro study, Appl. Sci. 11 (21) (2021). ARTN/9859/10.3390/app11219859.
P. Kosago, C. Ungurawasaporn, B. Kukiattrakoon, Comparison of the accuracy between conventional and various digital implant impressions for an implant-supported mandibular complete arch-fixed prosthesis: an in vitro study, J. Prosthodont. 32 (7) (2023) 616–624, https://doi.org/10.1111/jopr.13604.
H. Tohme, G. Lawand, M. Chmielewska, J. Makhzoume, Comparison between stereophotogrammetric, digital, and conventional impression techniques in implant-supported fixed complete arch prostheses: an in vitro study, J. Prosthet. Dent. 129 (2) (2023) 354–362, https://doi.org/10.1016/j.prosdent.2021.05.006.
M. Liu, X.J. Fu, H.C. Lai, J.Y. Shi, B.L. Liu, Accuracy of traditional open-tray impression, stereophotogrammetry, and intraoral scanning with prefabricated aids for implant-supported complete arch prostheses with different implant distributions: an in vitro study, J. Prosthet. Dent. 132 (3) (2024) 602, https://doi.org/10.1016/j.prosdent.2024.06.006, e1-602 e9.
M. Revilla-Leon, M. Gomez-Polo, M. Drone, A.B. Barmak, C. Guinot-Barona, W. Att, J.C. Kois, J.A. Perez-Barquero, Impact of scanning distance on the accuracy of a photogrammetry system, J. Dent. 142 (2024) 104854, https://doi.org/10.1016/j.jdent.2024.104854.
L.S. Prott, P.J. Atria, C.V. Maluf, M.B. Blatz, J. Conejo, In vitro comparison between complete arch abutment-level implant impressions with photogrammetry, grammetry, and intraoral scanning, J. Prosthet. Dent. 134 (3) (2025) 782, https://doi.org/10.1016/j.prosdent.2025.05.009, e1-782 e7.
F. Emir, S. Ayyildiz, Evaluation of the trueness and precision of eight extraoral laboratory scanners with a complete-arch model: a three-dimensional analysis, J. Prosthodont. Res. 63 (4) (2019) 434–439, https://doi.org/10.1016/j.jpor.2019.03.001.
D. Borbola, J. Vag, Unifying intraoral scanner, computer-aided manufacturing, and final crown accuracy: a virtual-fit method for marginal gap evaluation, J. Dent. 163 (2025) 106113, https://doi.org/10.1016/j.jdent.2025.106113.
B. Pätoprsty, M. Vozár, R. Hrusecky, I. Buransky, Comparison of optical 3D scanner and coordinate measurement system from the standpoint of macro-geometry measurement, J. Measurements Eng. 12 (1) (2024) 99–107, https://doi.org/10.21595/jme.2023.23533.
R. Mendricky, Aspects affecting accuracy of optical 3d digitization, Mm Sci. J. 01 (2018) 2267–2275, https://doi.org/10.17973/Mmsj.2018_03_2017106.
N. Sun, T. Bull, R. Austin, D. Bartlett, S. O'Toole, Quantifying error introduced by iterative closest point image registration, J. Dent. 142 (2024) 104863, https://doi.org/10.1016/j.jdent.2024.104863.
G.R. Goldstein, Making clinical sense of 3-dimensional metrology software programs, J. Prosthet. Dent. 131 (5) (2024) 925–932, https://doi.org/10.1016/j.prosdent.2023.06.021.
J. Vag, L. Romanszky, G. Sersli, M. DeFee, W. Renne, F. Mangano, D. Borbola, Application of the virtual-fit method for fixed complete denture cases designed on intraoral scans: effect of cement spacing, J. Dent. 141 (2024) 104780, https://doi.org/10.1016/j.jdent.2023.104780.
T. Jemt, L. Hjalmarsson, In vitro measurements of precision of fit of implant-supported frameworks. A comparison between "virtual" and "physical" assessments of fit using two different techniques of measurements, Clin. Implant Dent. Relat. Res. 14 (Suppl 1) (2012) e175–e182, https://doi.org/10.1111/j.1708-8208.2011.00416.x.
D. Borbola, A. Mikolicz, L. Romanszky, G. Sersli, M. DeFee, W. Renne, J. Vag, Complete-arch accuracy of seven intraoral scanners measured by the virtual-fit method, J. Dent. 149 (2024) 105281, https://doi.org/10.1016/j.jdent.2024.105281.
J.M. Loetzerich, S. Raith, S. Reich, Verification of a digital approach for three-dimensional evaluation of marginal and internal fit, J. Prosthet. Dent. 134 (1) (2025) 160–166, https://doi.org/10.1016/j.prosdent.2023.09.004.
A. Uribarri, E. Bilbao-Uriarte, A. Segurola, D. Ugarte, F. Verdugo, Marginal and internal fit of CAD/CAM frameworks in multiple implant-supported restorations: scanning and milling error analysis, Clin. Implant Dent. Relat. Res. 21 (5) (2019) 1062–1072, https://doi.org/10.1111/cid.12839.
F. Grande, A. Mosca Balma, F. Mussano, S. Catapano, Effect of Implant Scan body type, intraoral scanner and Scan Strategy on the accuracy and scanning time of a maxillary complete arch implant scans: an in vitro study, J. Dent. 159 (2025) 105782, https://doi.org/10.1016/j.jdent.2025.105782.
T. Sami, G. Goldstein, D. Vafiadis, T. Absher, An in vitro 3D evaluation of the accuracy of 4 intraoral optical scanners on a 6-implant model, J. Prosthet. Dent. 124 (6) (2020) 748–754, https://doi.org/10.1016/j.prosdent.2019.10.013.
D.J. McGregor, S. Rylowicz, A. Brenzel, D. Baker, C. Wood, D. Pick, H. Deutchman, C.H. Shao, S. Tawfick, W.P. King, Analyzing part accuracy and sources of variability for additively manufactured lattice parts made on multiple printers, Addit. Manuf. 40 (2021). ARTN/101924. 10.1016/j.addma.2021.101924.
M. Meloun, J. Militký, Errors in instrumental measurements, in: M. Meloun, J. Militký (Eds.), Statistical Data Analysis, Woodhead Publishing India, 2011, pp. 1–23.
L. Auskalnis, M. Akulauskas, D. Jegelevicius, T. Simonaitis, V. Rutkunas, Error propagation from intraoral scanning to additive manufacturing of complete-arch dentate models: an in vitro study, J. Dent. 121 (2022) 104136, https://doi.org/10.1016/j.jdent.2022.104136.
J. Katsoulis, R. Mericske-Stern, N. Enkling, K. Katsoulis, M.B. Blatz, In vitro precision of fit of computer-aided designed and computer-aided manufactured titanium screw-retained fixed dental prostheses before and after ceramic veneering, Clin. Oral Implants Res. 26 (1) (2015) 44–49, https://doi.org/10.1111/clr.12299.
M. Revilla-Leon, J.L. Sanchez-Rubio, J. Perez-Lopez, J. Rubenstein, M. Ozcan, Discrepancy at the implant abutment-prosthesis interface of complete-arch cobalt-chromium implant frameworks fabricated by additive and subtractive technologies before and after ceramic veneering, J. Prosthet. Dent. 125 (5) (2021) 795–803, https://doi.org/10.1016/j.prosdent.2020.03.018.
B. Yilmaz, E. Kale, W.M. Johnston, Marginal discrepancy of CAD-CAM complete-arch fixed implant-supported frameworks, J. Prosthet. Dent. 120 (1) (2018) 65–70, https://doi.org/10.1016/j.prosdent.2017.11.021.
B. Yilmaz, X. Guo, M. Schimmel, S. Abou-Ayash, Effect of industrial scanner and framework material interaction on the marginal gaps of CAD-CAM complete arch implant frameworks, J. Prosthet. Dent. 130 (5) (2023) 723–730, https://doi.org/10.1016/j.prosdent.2021.10.013.
T. Jemt, A. Lie, Accuracy of implant-supported prostheses in the edentulous jaw: analysis of precision of fit between cast gold-alloy frameworks and master casts by means of a three-dimensional photogrammetric technique, Clin. Oral Implants Res. 6 (3) (1995) 172–180, https://doi.org/10.1034/j.1600-0501.1995.060306.x.
J.O. Villalobos, Mean absolute error vs root-Mean square error. https://www.brainstobytes.com, 2019.
F.G. Mangano, D. Cianci, N. Pranno, H. Lerner, F. Zarone, O. Admakin, Trueness, precision, time-efficiency and cost analysis of chairside additive and subtractive versus lab-based workflows for manufacturing single crowns: an in vitro study, J. Dent. 141 (2024) 104792, https://doi.org/10.1016/j.jdent.2023.104792.
A. Mehl, S. Reich, F. Beuer, J.F. Guth, Accuracy, trueness, and precision - a guideline for the evaluation of these basic values in digital dentistry, Int. J. Comput. Dent. 24 (4) (2021) 341–352.
R. Mendricky, Determination of measurement accuracy of optical 3d scanners, MM Sci. J. 06 (2016) 1565–1572, https://doi.org/10.17973/mmsj.2016_12_2016183.
MSA_Work_Group, Measurement Systems Analysis Reference Manual, 4th Edition ed., Chrysler Group LLC, Ford Motor Company, and General Motors Corporation, 2010.
V. Rutkunas, J. Dirse, D. Kules, T. Simonaitis, Misfit simulation on implant prostheses with different combinations of engaging and nonengaging titanium bases. Part 1: stereomicroscopic assessment of the active and passive fit, J. Prosthet. Dent. 129 (4) (2023) 589–596, https://doi.org/10.1016/j.prosdent.2022.04.009.
J. Abduo, K. Lyons, Effect of vertical misfit on strain within screw-retained implant titanium and zirconia frameworks, J. Prosthodont. Res. 56 (2) (2012) 102–109, https://doi.org/10.1016/j.jpor.2011.09.001.
A. Bacchi, R.L. Consani, M.F. Mesquita, M.B. Dos Santos, Effect of framework material and vertical misfit on stress distribution in implant-supported partial prosthesis under load application: 3-D finite element analysis, Acta Odontol. Scand. 71 (5) (2013) 1243–1249, https://doi.org/10.3109/00016357.2012.757644.
J. Abduo, R.B. Judge, Implications of implant framework misfit: a systematic review of biomechanical sequelae, Int. J. Oral Maxillofac. Implants 29 (3) (2014) 608–621, https://doi.org/10.11607/jomi.3418.